Victor Szwed
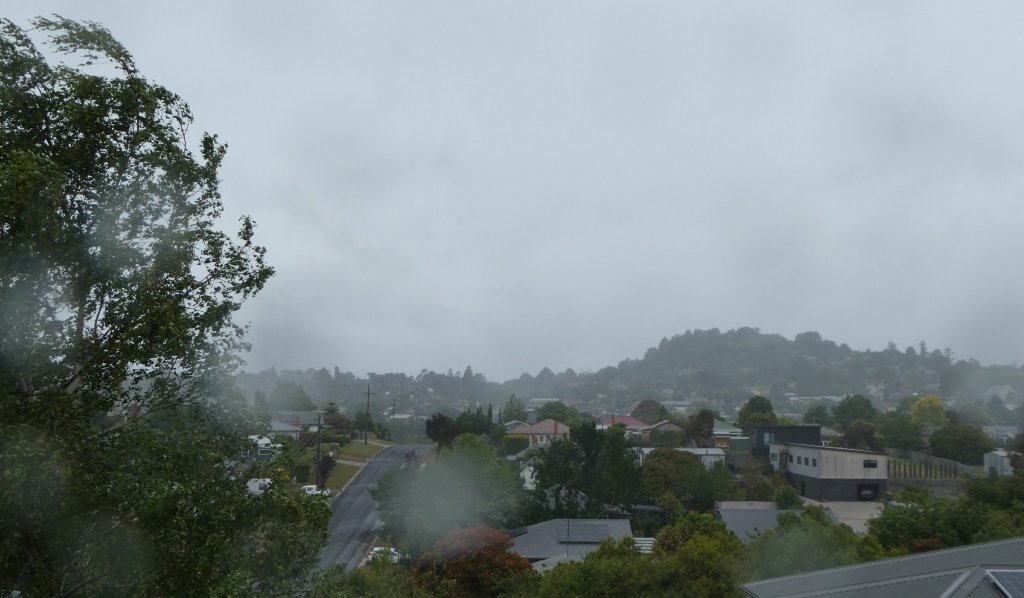
The rainfalls on Wednesday were very much “hit and miss” across Victoria. A few towns received very heavy rainfalls of 50mm and more with Swan Hill being hit by 85mm. Some areas received 20 to 50mm and most much less. By the time the system reached Central Victoria, it had dissipated to patchy rain.
We received 6mm of rain on Wednesday this week and another 5mm on Thursday. This brought the November total to around 42mm which compares to the long-term average of 61.6mm for the month. Rainfall for the year totals some 712mm which is well below the long-term average of 839mm to the end of November.
After fairly good rains for the January to June period, the last five months have been well below average. The Bureau forecast is for below average rainfall for much of Australia over summer, particularly the northern half of the continent. Southern areas including Central Victoria are expected to receive lower than average rains but not as severe.
The El Nino conditions are strong and are expected to continue at least into autumn. Warmer than average sea surface temperatures exist in tropical Pacific areas and warmer temperatures below the surface will reinforce these conditions. These and other factors which the Bureau monitors indicate chances are 60% to 80%, that day and night temperatures will be above average.
Lower rainfall has reduced soil moisture levels across most of Australia. Here in Daylesford and district, gardeners have been observing this. While milder growing conditions have been welcome for growing vegetables, the need to mulch, to water and choose plants which need less water is increasing. The milder conditions encourage beneficial bugs as well as harmful bugs, so keep an eye out on these before the nasties do too much damage.
Here in Central Victoria we have not had significant warm spring days of 25 to 30 degrees compared to some years. However, we have had fewer frosts and milder nights which boost overall average temperatures.
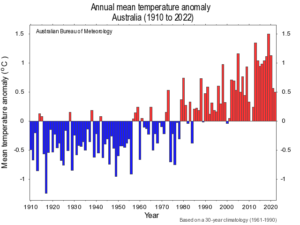
The Bureau of Meteorology provides the following long-term graph of Annual Mean Temperature Anomalies for Australia from 1910. The data is factored around the 1960 to 1990 thirty-year period which had just as many cooler years as it did warmer, so it provides a decent base to compare and highlights how mean temperatures have really increased significantly in the past four decades.
The graph clearly shows that average temperatures have risen significantly since 1910. Looking at 120 years of records shows that this is not a climatic pattern that occurs over time, as some doubters suggest. Scientific evidence is clear that human activities have been a key factor. Pumping massive amounts of carbon into the atmosphere has added significantly to global warming and changes in climate.
Thanks to the Bureau of Meteorology and their web site which provides this information among much more.
Victor Szwed is a Daylesford resident who contributes a monthly column on the weather.


