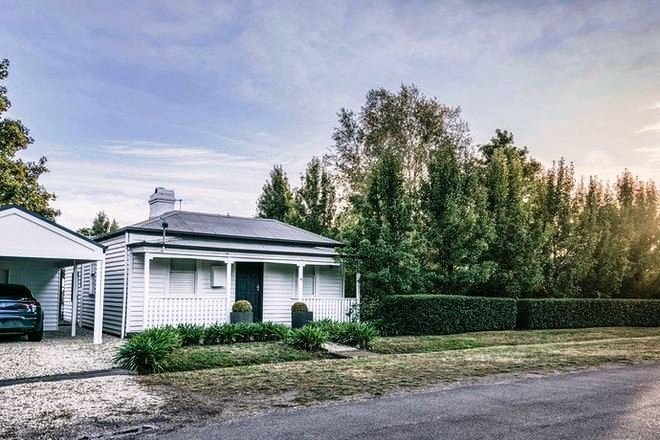
As reported in the Wombat Post last month, there seem to be properties for sales in most streets. However, it also appears more “Sold” signs are appearing.
Based on data from realestate.com.au for postcodes 3460 and 3461, the first two months of the April-June quarter have seen a very significant increase in the sales rate compared to the first quarter.
In the calendar year to date (31 May), 60 houses and 18 land blocks were reported as sold.
House sales for Daylesford properties increased from a monthly average of 5 for the first quarter to 9 per month in the second quarter.
For the total reporting area, 32 houses were sold in 2 months (April and May) compared to 28 for the previous quarter.
Although the rise may be seasonal, industry sources attribute much of the improvement to more realistic pricing and improved interest rate sentiment.
The large number of properties on the market reflect the increases to interest rates. Many investors are exiting the market citing the impact of the hike in land tax and the increased cost of government compliance. This has seen a number of short-term accommodation and long term rental properties being offered for sale. While there has been a modest drop in sale prices, it is expected to impact the availability and affordability of long term rentals with sales going to either new owner-occupiers or to investors. Investors will have a higher cost base due to land tax changes and increase compliance costs leading to a need for better rental returns.
Of the 46 houses that reported their sale price, 15 (33%) were under $700K, nine of which were in Daylesford. Another fifteen properties were over the $1 million point. Fourteen properties did not disclose a sale price.
Year to date property sales by agent
| Belle | 28 | 46.7% |
| McQueen | 13 | 21.7% |
| Biggins | 8 | 13.3% |
| Jellis Craig | 7 | 11.7% |
| Others | 4 | 6.7% |
Houses Sold
| Area | 01 Jan – 31 Mar | 01 Apr – 31 May | Jan 01 – 31 May |
| Daylesford | 15 | 18 | 33 |
| Hepburn | 7 | 3 | 10 |
| Glenlyon | 2 | 2 | 4 |
| Others | 4 | 9 | 13 |
|
Total |
28 |
32 |
60 |
Land Sold
| Area | 01 Jan – 31 Mar | 01 Apr – 31 May | Jan 01 – 31 May |
| Daylesford | 4 | 1 | 5 |
| Hepburn | 0 | 0 | 0 |
| Glenlyon | 3 | 1 | 4 |
| Others | 6 | 3 | 9 |
|
Total |
13 |
5 |
18 |


